

Data Visualization
Do you want to create the ultimate, useful, intuitive data visual? Whether you are new to data visualization, familiar with it, or an expert, there is a lot to know besides how to use your favourite data visualization tool. There are best practices relating to the presentation of data in visual form that supersede the mechanics of tools like T
Read More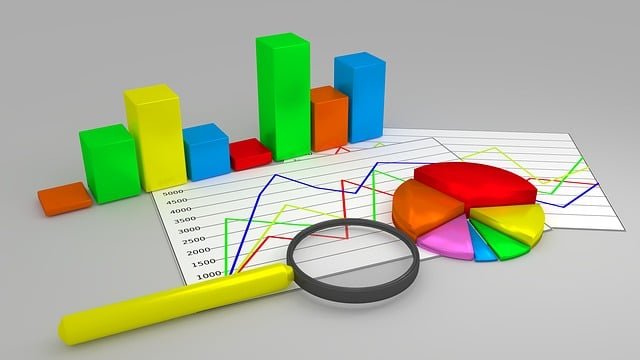
For centuries it has been proven that humans are exceptional at processing complex information when it is presented in visual form. We’re able to perceive and distinguish between subtle variations in shape, size, position, orientation, hue, brightness, contrast etc. when viewing a visual representation of information, which may otherwise not be v
Read More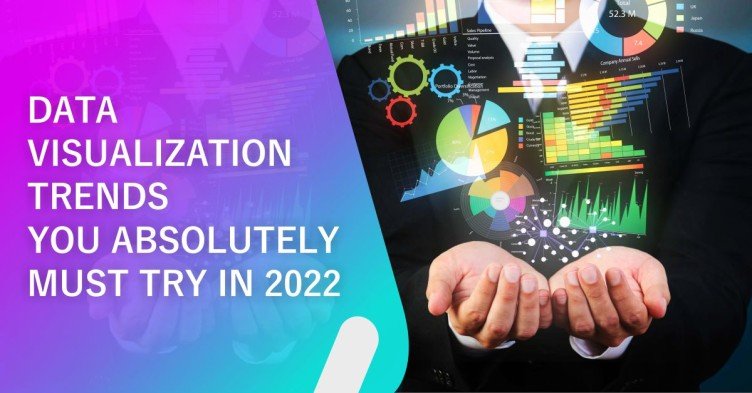
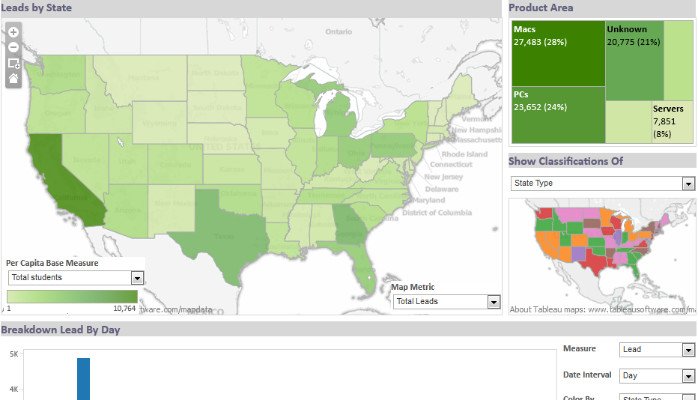
Data Visualisation is a powerful tool that can be used to uncover hidden insights. It is an amazing way to get at the truth and see things in ways you never could before. Data dashboarding is a great way to let your data do the talking, and newer tools and techniques are innovated regularly. In a world where data is king and information can be acce
Read More
As pretty much everyone and their robot dog is now aware, there are jaw-dropping breakthroughs happening in artificial intelligence (AI) on an almost daily basis. To those of us in the data visualization field, this begs the obvious question: Will AIs be able to create expert-level charts without any human intervention, and, if so, when might that
Read More

